SUMMARY
Kaplan and Bulb turbines can operate at a high efficiency for a wide range of flow rates and heads due to their double-regulated characteristics, which allows adjusting of the positions of both wicket gates and runner blades. The maximum efficiency is achieved by determining the optimal runner blade angle to wicket gate positioning for a given head, which is called a combination (CAM) curve. These curves are initially generated from scaled model tests and are later on validated in the field by index testing. The index testing is usually costly and only provides the combination curve for a single value of the head. The automatic optimizing system demonstrated in this paper measures and calculates the optimal positioning between the wicket gate and runner blades at the various heads. Important variables are measured to determine the turbine efficiency, such as power, net head, and flow rates. The system interfaces with the governor to test the combination that maximizes the efficiency during normal operation of the machine. This system is already installed in three units operated by Enel Green Power, who economically and technically supported this research. This paper presents the efficiency gains achieved using the automatic optimizing system. The efficiency gain will either result in an increase of output power at normal operation, or can reduce the water volume used to produce the same output power, depending on the operational mode of the turbine.
KEYWORDS
Kaplan turbines, Bulb turbines, Efficiency optimization, Index test, Combination curve, CAM curve.
- INTRODUCTION
Even with the growing adoption of other renewable energy sources such as wind and solar power, hydroelectric power still has a leading position when it comes to energy conversion to electrical power [2]. At the same time that new power plants are being built to increase generation capacity, it is also possible to increase the efficiency at existing hydro plants. For Kaplan and Bulb turbines, the so-called combination curve or cam curve (CC) is of key importance for the efficiency of the turbine, and is defined as the relationship between the wicket gate (WG) opening and the runner blades (RB) angle. As a result, these turbines can change the angle of attack of the water, allowing the turbine to operate over a wider operating range of the turbine head [3].
The CC is usually provided by the turbine manufacturer based on scaled model tests or turbine model simulations. In practice, the CC should be validated in the field with the turbine operating in its normal environment by means of a procedure referred to as index testing. This test, defined in IEC 60041 [4], is summarized as follows: for finding the optimal double regulation, the RB is fixed at a certain position, while the WG opening is changed to evaluate the efficiency. This procedure is then repeated for the feasible range of RB positions. According to IEC 60041, the test should be performed for at least 5 different positions of the RB, each of them with 5 or more positions of the WG. However, performing the index test is not a simple task. It requires operation over a wide range, which must be coordinated and agreed to by the grid operator. Index tests are also relatively expensive, as they require that specialized personnel will be involved, generally contracted from third party companies. Furthermore, the results obtained by the index tests are valid for a single net head, which is extrapolated to other heads, introducing a significant degree of inaccuracy. Moreover, the CC is subject to changes over time, given the mechanical wear of various mechanical components. One example of how the CC can change over time is shown in Figure 1. Hence, for operating the unit at the maximum efficiency, a one-time index test is not sufficient, and a continuous evaluation of the most optimal CC should be performed to maintain the maximum efficiency over time.
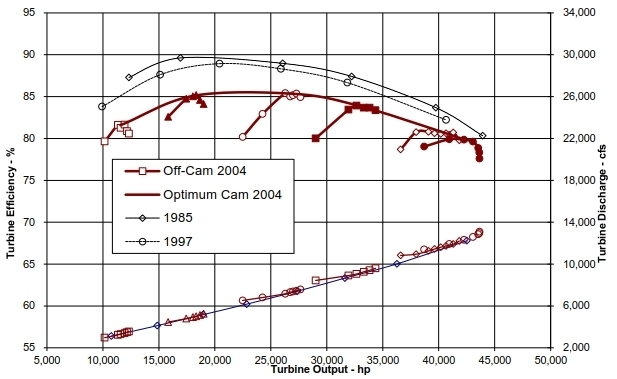
Figure 1: Change in the CC over time [5]
Operating Kaplan and Bulb turbines with an optimal CC brings a series of advantages. The turbine itself will be less exposed to cavitation effects, which is the major cause of wear for this kind of turbines [6]. Operating the unit with less cavitation will reduce the frequency of maintenance overhauls and lead to increased efficiency, which saves water. For small hydro plants, water consumption is always relevant, as the reservoir does not store water for long periods. For large plants and power systems, saving water is important to maintain hydro generation during dry periods, reducing the need to dispatch non-renewable plants at higher production costs.
In this context, the paper explores how the optimal CC can be identified using an automatic system, which is able to identify and update the CC without performing a complete index test. This can be done at the same time, while the unit is running under normal operating conditions and generating power. The automatic CC optimization system has the benefit of continuously providing the optimal relationship between wicket gate opening and runner blade angle at various heads, resulting in a higher turbine efficiency over the life of the unit. The paper also discusses the instrumentation required as input to the automatic CC optimization, which is the same used for the traditional index testing, as well as how the optimum CC is determined from the acquired operating points. The interface to the existing governor and its constituent parts is also reviewed. Prototypes of the automatic CC system were developed and installed in three units with different characteristics. The testing methodologies for these plants are presented and the preliminary results are discussed. We assess the impact of the increased efficiency obtained using the optimal CC and/or the reduced water consumption related to generating the power. Simulation based on the historical data from generating units was used to estimate the financial impact of saving water in different scenarios.
This paper is organized as follows: Section 2 presents the instrumentation required and used in this system; Section 3 focuses on the concept of the optimization system; Section 4 details the methodology for testing and evaluating the benefits of the system; Section 5 the obtained CC is presented and compared to the original one; Section 6, the operation with each of the CCs is compared to show the improvement in the efficiency; Section 7, the long-time benefits of running the units with an optimal CC; Section 8, the conclusions of the work are summarized.
- INSTRUMENTATION
Certain instrumentation is required to evaluate turbine efficiency. In order to minimize the uncertainty related to external measurements, all variables were measured by the optimization system itself.
2.1. Optimization system panel
The optimization system is executed on a microprocessor unit that is installed inside a wall-mounted panel. This panel contains power supply devices, the microprocessor unit and the I/O interface module. A touchscreen human-machine interface (HMI) is also available for the operation of the system.
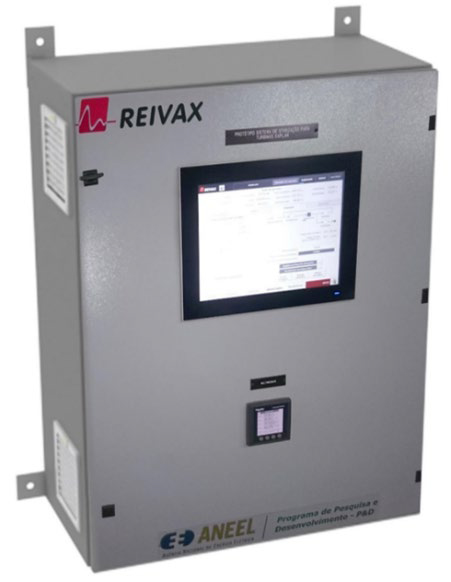
Figure 2: Optimization system panel [5]
2.2. Measurements
2.2.1. Active power
Dedicated potential (PT) and current transformers (CT) were used for measuring the active power in the installed prototypes. The measurement is performed by a three-phase transducer in the panel.
2.2.2. Head
The head is measured according to the methods defined in IEC 60041 [3], which are based on the Bernoulli equation. Two different methods were tested in this work: (i) difference between headwater and tailwater levels, subtracting a term that is proportional to the squared flow rate to compensate for friction losses in the penstock; (ii) difference between the spiral case entrance pressure and the tailwater level, when this pressure was available.
The measurements of headwater level, tailwater level, and spiral case entrance pressure were obtained from sensors providing a mA current to the I/O interface module. The measurements for headwater and tailwater levels are often available in the governor, and the same transducer was used. All signals were isolated in the panel by transducers, so the optimizer would not produce interference in the governor operation.
2.2.3. Position of the actuators
The positions of the WG (Yga) and RB (Yru) are obtained from the same transducers used by the governor. The current or voltage circuits that bring the signals to the governor panel are used by the optimizer panel to read the position of the actuators and are isolated in the panel with transducers.
2.2.4. Flow rate measurement
Technologies for flow rate measurements are defined on IEC 60041 [4], as methods for primary measurements – which are able to measure an absolute value for the flow rate – and secondary methods – which obtain a relative value. Absolute measurements are necessary for applications that require a power guarantee as an acceptance test, e.g. in turbine refurbishment contracts. IEC 60041 states that the relative measurement of the flow rate is enough for determining the CC.
Two different methods were employed in this project to test the concept: (i) a differential pressure measurement to obtain the flow rate through Winter-Kennedy method (Figure 3 (a)); (ii) acoustic measurement (Figure 3 (b)).
Figure 3 (a): Differential pressure transducer [5]
Figure 3 (b): Flow rate acoustic transducer [5]
- OPTIMIZATION SYSTEM
The main objective of the proposed system is to calculate the CC during online tests that require the minimum impact on the existing system and on the operation of the unit. The features that comprise this will be described in the following. The system will be called ECCO (Efficiency and Combination Curve Optimization) system.
3.1. Governor interface
The first requirement is that the system would not directly operate the hydraulic actuators of the turbine. As the governor is responsible for monitoring and controlling the actuators, it is better that this is not changed by an external system. In order for the ECCO system to adjust the wicket gate and the runner blades, it sends raise/lower commands to the governor to adjust the references. Hence, the raise/lower interface is normally standard for any type of governor, so the ECCO system can easily interface with the existing governor.
3.2. Local search
One requirement that was investigated for this system is how the CC could be obtained during the normal operation of the generating unit, so that it can operate continuously. This is called the local search optimization mode because the operating point of the unit is maintained. In this mode, small changes in Yga and Yru are gradually applied to identify the combination that maximizes the efficiency for that condition of turbine power and head.
The changes in Yga and Yru are performed such that the active power remains constant during the local search. This allows using ECCO system to optimize the CC under normal operation.
3.3. Automated index test (scan mode)
As all the instrumentation that is required for an index test is already available in the ECCO system, it could also automate that test, by collecting and storing data using a similar procedure. This is called “scan mode” optimization, with the aim to record the efficiency over a wider operating range of Yga and Yru. The advantage of it is that all data is automatically recorded, so it does not require manual calculation of the efficiency after the test is performed. The movement of the gate and the blades is also automated, including the calculation of the movement step and identification of the steady state.
Operational limits are defined for the monitored variables, so that unsafe operation of the optimization system is completely avoided. If the limits are reached, the optimization process is either cancelled or the unit is brought back to a safe point of operation. Vibration monitoring systems can also be coordinated with ECCO to prevent unsafe operation.
3.4. Combination curve calculation and update
Once sufficient data is collected in the ECCO database, it is possible to calculate a new optimal CC for the turbine with the information gathered from both the local search and scan mode. The CC is constructed for different values of the head.
This CC can be sent automatically to the governor through a communication protocol when it is available. Otherwise, the curve can be accessed on the HMI and copied to the governor.
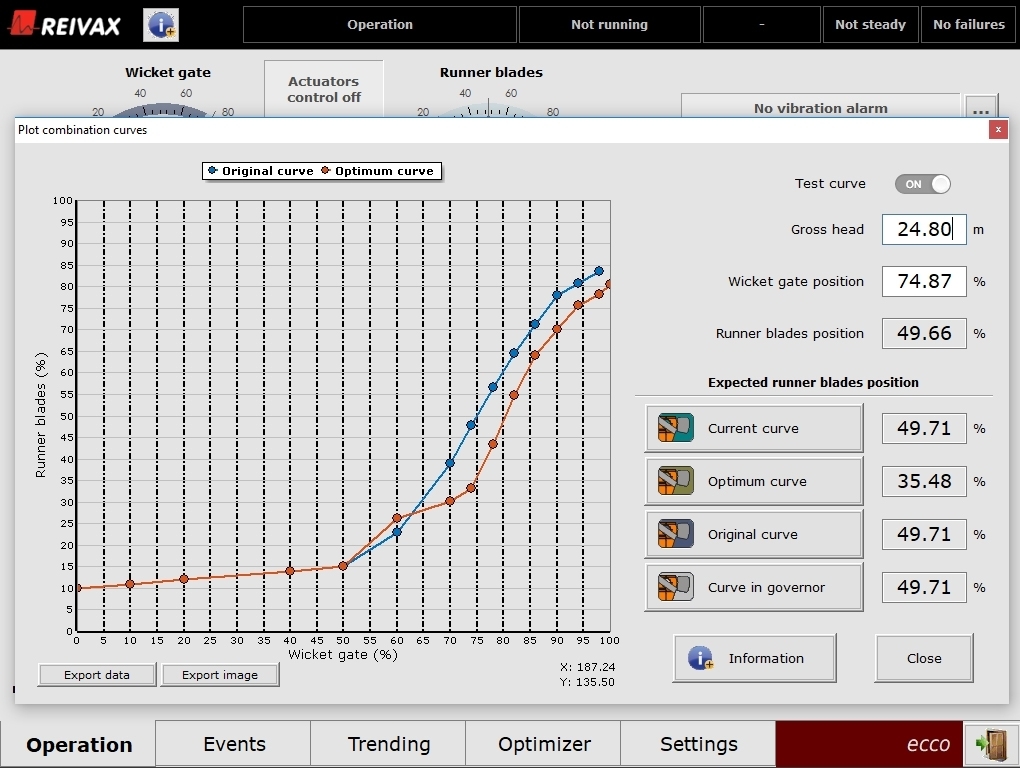
Figure 4: HMI of the optimization system showing the computed CC [5]
- EXPERIMENTAL SETUP
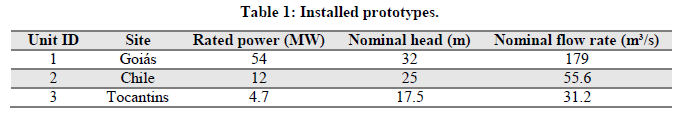
Prototypes of the system have been produced and installed in three units, presented in Table 1.
Table 1: Installed prototypes.
The following tests were performed with the optimization system:
- Local search optimization: the automatic search was enabled for some months to optimize the CC around the normal operating points. This allows collecting data over a range of turbine power and also allows optimizing operation according to the fluctuations in the head value, due to the hydrological regimen of the power plant;
- Scan optimization: this populates the database with a variety of operating points that are not usually accessed during normal operation of the unit. This develops the CC for the entire operating range rather than only for the normal operating points that would be tested by the local search. The scan optimization was executed when the optimization systems were commissioned, while the unit power could be widely changed;
- Comparison of the CCs: after enough data was collected with the aid of the automatic local search and the scan optimization, the optimal CC was calculated using the developed algorithm. A special function was created in the ECCO system to update the governor CC, allowing an automatic comparison test that is performed by ECCO. The original and optimal curves are compared, storing the efficiency and all other variables over time in the system memory. This comparison is performed daily by the ECCO system.
Another important task for the evaluation of the impact of the operation with the optimal CC is to simulate this operation over time, calculating the additional power and/or reduction of water consumption. This is discussed in detail in Section 7.
- CALCULATED COMBINATION (CAM) CURVE
After collecting data for the processing phase, the CC was calculated for a variety of head values. The average time to collect this data was about six months. In all units, some variation between the original CC and the optimal calculated curves was detected.
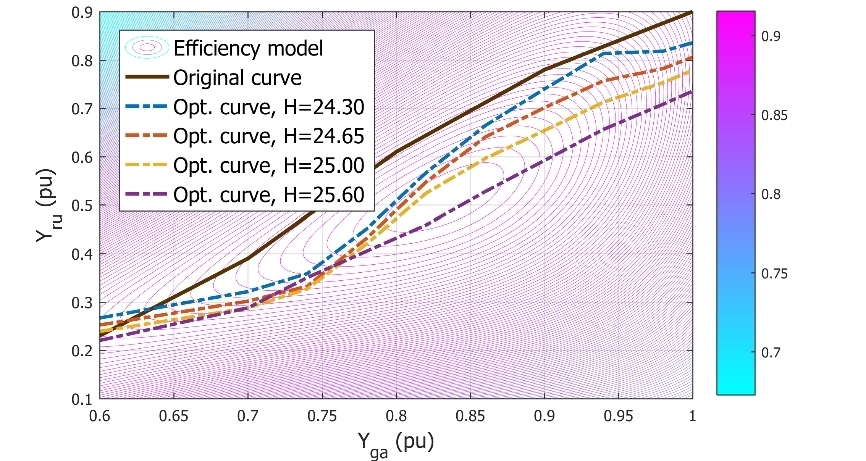
Figure 5: Comparison of original and optimal curves for Unit 2 [5]
- MEASURED RESULTS
As described in Section 4, the operation with the original and the new CCs was compared to verify how much the efficiency is increased. One of these tests is presented in Figure 6 below, where the original CC was replaced by the optimal CC at time instant 6700 s. In the new steady state operating point that is attained after switching, the efficiency increases more than 0.9%. As the governor operates with constant level control, the flow rate is almost constant. The long-term benefits of this case are discussed in item 7.2.1.
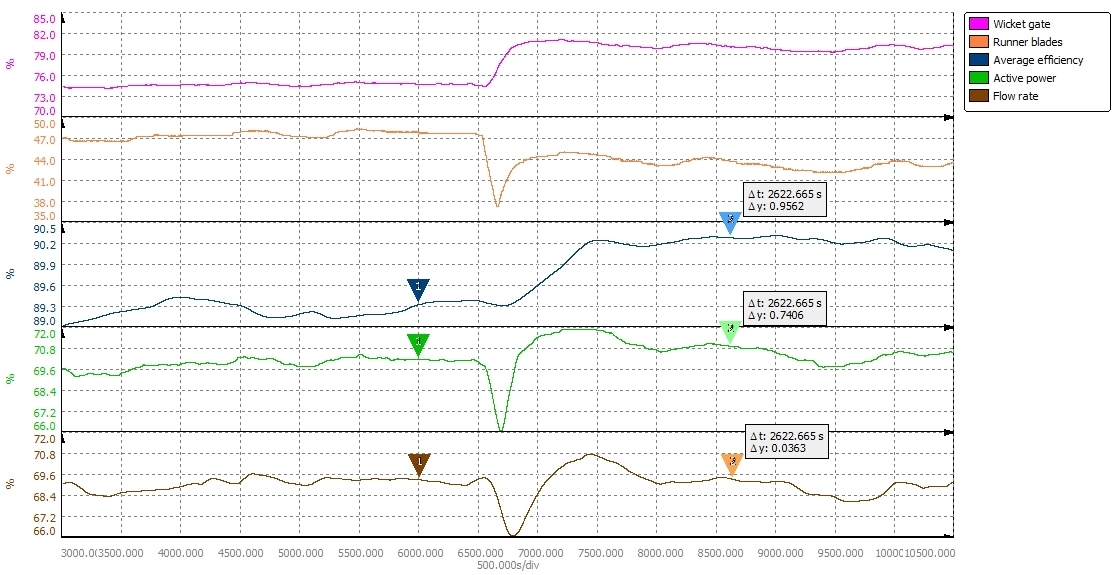
Figure 6: Operation with the original CC (before 6700 s) and optimal CC (after 6700 s) for Unit 2 [5]
The same test was applied for a unit that operates with power control, with results presented in Figure 7.In this case, the active power remains almost constant after switching the CC, while the flow rate decreases about 0.7%. The efficiency also increases more than 0.9%. The long-term benefits of this case are discussed in item 7.2.2.
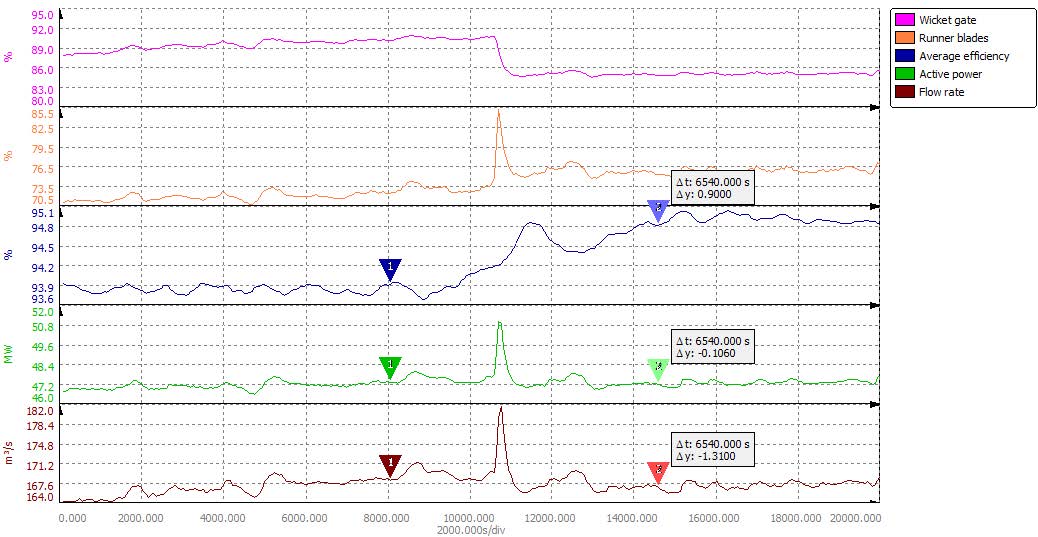
Figure 7: Operation with the original CC (before 10500 s) and optimal CC (after 10500 s) for Unit 1 [5]
- LONG-TERM BENEFITS
Once the average gain in efficiency was demonstrated by field tests, the long-term benefits of operating with the optimal curve could be quantified as the additional energy generated and/or saved water volume. In order to answer this question, historic operational data from the generating units was collected to serve as a reference.
In a previous work, models for the flow rate Q(Yga ,Yru ) and efficiency η t (Yga ,Yru ) were developed based on field data [7]. That is, the flowrate and efficiency can be obtained from these models based on the head and positions of the wicket gate (Yga) and runner blades (Yru).
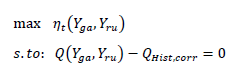
Thus, the efficiency can be calculated for the historical data, comparing the results of the original curve with the results that would be obtained with the optimal curve. The MATLAB® optimization toolbox was used to calculate the optimal curve. Two different modes of operation were examined:
(1) Increase in power generation, for units that operate with level control. This was based on the fact that the unit would operate with the same flow rate for both CCs. This is the case with many small and flow-of-the-river hydro power plants;
(2) Savings in water consumption, for units that operate with power control. In this problem, the unit operates with the same power for both CCs.
7.1. Historical data
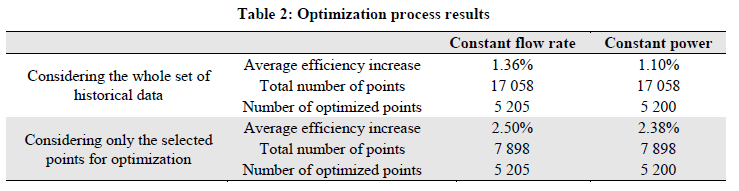
For the Chilean unit, the collected data comprised of the headwater levels, tailwater levels, active power, and flow rate over six months, with a sample rate of 15 minutes. The data for the optimization system was selected from this entire set, so to exclude points where the unit was not in service or the collected information was not complete. 7898 data points were available after this data selection and were used to obtain the optimal CC using the optimization toolbox. After this optimization, the efficiency was increased in 5205 of these points. The corresponding operating points of the database were then replaced by the optimization results to compute the overall gain in the efficiency. The results are presented in Table 2, considering that the operating point is maintained constant between each sampling instant.
Table 2: Optimization process results
7.2. Simulation results
As explained before, two modes of operation were examined to calculate the gain while operating with the optimal curve: (1) fixed flow rate to determine the increase in power output and (2) fixed output power to determine the savings in water consumption.
7.2.1. Increase in power generation
The following steps were applied for the optimization with constant flow rate:
(1) The flow rate in the historical data was normalized according to the reference head of the model. Details about this can be found on [7];
(2) Modelling of the efficiency, when the flow rate of the model is equal to the flow rate of the historical data:
(3) Definition of operational limits included in the intervals 0.3 ≤ Yga ≤ 1, 0.16 ≤ Yru ≤ 1;
(4) Comparison of the historical efficiency efficiencyηt,Hist with ηt(Yga*, Yru*), where Yga* and Yru* are the identified optimal values.
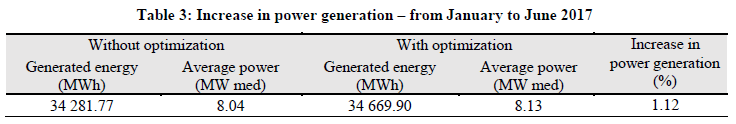
The increase in power generation is presented in Table 3.
Table 3: Increase in power generation – from January to June 2017
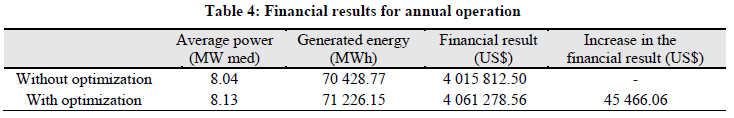
 The average value of US$ 57 per MWh for selling hydropower was obtained from the energy auction by CCEE in December 2017 [8]. The financial results of the simulation above are demonstrated in Table 4, with the time span extrapolated to one year.
Table 4: Financial results for annual operation
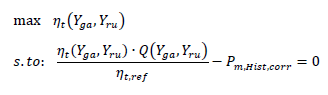
7.2.2. Savings in water consumption
In the case where the output power is kept constant, the increased efficiency will reduce water consumption. The simulation includes the following steps:
(1) The power in the historical data was converted for the reference head of the model;
(2) Calculate the efficiency η t ,ref of turbine nominal values;
(3) Modelling of the efficiency when the power output of the model is equal to the power from the historical data:
(4) Definition of operational limits included the intervals 0.3 ≤ Yga ≤ 1, 0.16 ≤ Yru ≤ 1;
(5) Same constraint for constant power, for href = 1 pu;
(6) Comparison of the historical efficiency ηt,Hist with ηt(Yga*, Yru*), where Yga* and Yru* are the identified optimal values.
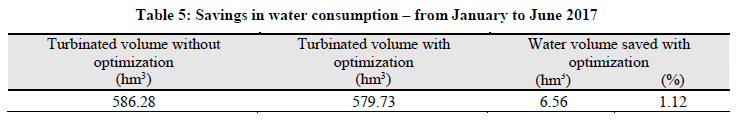
The savings in water consumption are presented in Table 5.
Table 5: Savings in water consumption – from January to June 2017
- CONCLUSION
This work has presented an optimization system that is capable of determining the CC to maximize the turbine efficiency during the normal operation of the generating unit. It shows that such a system is feasible and can be installed without many changes in the generating unit’s operation.
The optimization modes for local search and scan mode performed accurately in the field, generating the database needed for the construction of the CC. The algorithm created for the construction of the CC was validated and the obtained curve resulted in an increase in efficiency when tested in the installed units. The system was able to optimize the CCs in all three units.
An average increase of 0.7% in the efficiency was found to be possible in the tested units. This increase may be higher or lower, depending on the operating point. The financial benefit over a year was demonstrated, leading to a profitability increase of US$ 45,466.06 for a 12 MW rated unit.
Moreover, the optimized CC also decreased the vibration in the turbine, resulting in a reduced overall noise level in the plant. While not yet quantified, the reduced vibrations will also lower the turbine maintenance cost and extend the life expectancy of the turbine.
- ACKNOWLEDGEMENT
The authors gratefully acknowledge the vital support received from Enel Green Power for the field tests in their power plants.
- BIBLIOGRAPHIC REFERENCES
[1] Theron, A., 2017. High cost of a Kaplan turbine project: The ‘whys’ explained. [online] ESI-Africa.com. Available at: <https://www.esi-africa.com/regional-news/africa/high-cost-of-a-kaplan-turbine-project-the-whys-explained/> [Accessed 6 August 2019].
[2] F. R. FØrsund, Hydropower Economics, 2nd ed., Springer, 2015.
[3] D. K. Okot, “Review of small hydropower technology,” Renewable and Sustainable Energy Reviews, vol. 26, pp. 515–520, Oct. 2013.
[4] IEC 60041:1991, “Field acceptance tests to determine the hydraulic performance of hydraulic turbines, storage pumps and pump-turbines”, 1991.
[5] Mesa Associates, Inc. and OAK RIDGE NATIONAL LABORATORY, “Best Practice Catalog Propeller/Kaplan Turbine.”, Jun. 2011.
[6] P. Kumar, R.P. Saini, “Study of cavitation in hydro turbines—A review”, Renew. Sustain. Energy, Rev. 14, 2010, pp. 374–383.
[7] H. A. Menarin et al, “Dynamic modelling of Kaplan turbines including flow rate and efficiency static characteristics”, IEEE Transactions on Power Systems. Under submission.
[8] CCEE. “Generation Auction No. 02 – 26th Energy Auction From New Generation Projects (A-6)”, Dec. 2017

